With the next Hungarian GP taking place, Red Bull Racing Honda is leading the 2021 Constructor Standings by only 4 points. In the haunt is Mercedes with their two drivers Lewis Hamilton and Valtteri Bottas, placing 2nd and 4th respectively in the Driver Standings.
After a controversial accident in Silverstone leaving Verstappen out of the race, Red Bull’s pilot is still leading the Driver Standings. In the other hand, his teammate Sergio Pérez could only steal Mercedes the extra point awarded for fastest lap, leaving him in the 5th position just 9 points away from 3rd place.
Given that Red Bull and Mercedes drivers are fighting both Championships, let’s analyze their results in the races 2015-2020.
Web Scraping using rvest
First, we will scrape the data from formula 1 official site.
# scrape data from web pages
library(rvest)
# for removing the span nodes
library(xml2)
# Cleaning and transforming data
library(dplyr)
library(tidyr)
# Data visualization
library(ggplot2)
Checking if we can manage to correctly extract 2020 table using its URL.
# Converting to xml
hungary_test_2020<-read_html("https://www.formula1.com/en/results.html/2020/races/1047/hungary/race-result.html")

# Extracting table tags and transforming them into a list of data frames
h_results_2020 <- hungary_test_2020 %>%
  html_nodes("table") %>%
  html_table()

h_results_2020<-h_results_2020[[1]]

h_results_2020
## # A tibble: 20 x 9
##    ``    Pos      No Driver            Car       Laps `Time/Retired`   PTS ``
##    <lgl> <chr> <int> <chr>             <chr>    <int> <chr>          <int> <lgl>
##  1 NA    1        44 "Lewis\n        … Mercedes    70 1:36:12.473       26 NA
##  2 NA    2        33 "Max\n          … Red Bul…    70 +8.702s           18 NA
##  3 NA    3        77 "Valtteri\n     … Mercedes    70 +9.452s           15 NA
##  4 NA    4        18 "Lance\n        … Racing …    70 +57.579s          12 NA
##  5 NA    5        23 "Alexander\n    … Red Bul…    70 +78.316s          10 NA
##  6 NA    6         5 "Sebastian\n    … Ferrari     69 +1 lap             8 NA
##  7 NA    7        11 "Sergio\n       … Racing …    69 +1 lap             6 NA
##  8 NA    8         3 "Daniel\n       … Renault     69 +1 lap             4 NA
##  9 NA    9        55 "Carlos\n       … McLaren…    69 +1 lap             2 NA
## 10 NA    10       20 "Kevin\n        … Haas Fe…    69 +1 lap             1 NA
## 11 NA    11       16 "Charles\n      … Ferrari     69 +1 lap             0 NA
## 12 NA    12       26 "Daniil\n       … AlphaTa…    69 +1 lap             0 NA
## 13 NA    13        4 "Lando\n        … McLaren…    69 +1 lap             0 NA
## 14 NA    14       31 "Esteban\n      … Renault     69 +1 lap             0 NA
## 15 NA    15        7 "Kimi\n         … Alfa Ro…    69 +1 lap             0 NA
## 16 NA    16        8 "Romain\n       … Haas Fe…    69 +1 lap             0 NA
## 17 NA    17       99 "Antonio\n      … Alfa Ro…    69 +1 lap             0 NA
## 18 NA    18       63 "George\n       … William…    69 +1 lap             0 NA
## 19 NA    19        6 "Nicholas\n     … William…    65 +5 laps            0 NA
## 20 NA    NC       10 "Pierre\n       … AlphaTa…    15 DNF                0 NA
Now we create the function that will let us extract all the race results tables from 2015-2020. We just pass to the function a vector with all the URLs.
# Extract tables from html and transform it to tibble
get_f1_table<-function(url){
  xml_doc<- read_html(url)
  list_result <- xml_doc %>%
  html_nodes("table") %>%
  html_table()
  table_result<-list_result[[1]]
  return(table_result)
}


# Vector with the race results URLs from 2020-2015
hungarian_urls<-c("https://www.formula1.com/en/results.html/2020/races/1047/hungary/race-result.html","https://www.formula1.com/en/results.html/2019/races/1011/hungary/race-result.html","https://www.formula1.com/en/results.html/2018/races/990/hungary/race-result.html","https://www.formula1.com/en/results.html/2017/races/969/hungary/race-result.html","https://www.formula1.com/en/results.html/2016/races/947/hungary/race-result.html","https://www.formula1.com/en/results.html/2015/races/927/hungary/race-result.html")

# Each element of the list is a yearly result
results_2020_2015<- lapply(hungarian_urls, FUN = get_f1_table)

# year 2020
hungary_2020<- results_2020_2015[[1]]
Data preparation
Getting rid of empty columns, cleaning drivers name and creating a single data frame for all the race results
cleaning_f1_results<-function(year_df){
  year_df <- year_df %>%
    select(Pos:PTS)
  year_df$Driver<-gsub("\n","",year_df$Driver)
  return(year_df)
}
# Cleaning all tables
results_2020_2015<- lapply(results_2020_2015, FUN = cleaning_f1_results)
results_2020_2015[[1]]
## # A tibble: 20 x 7
##    Pos      No Driver                    Car           Laps `Time/Retired`   PTS
##    <chr> <int> <chr>                     <chr>        <int> <chr>          <int>
##  1 1        44 Lewis                   … Mercedes        70 1:36:12.473       26
##  2 2        33 Max                    V… Red Bull Ra…    70 +8.702s           18
##  3 3        77 Valtteri                … Mercedes        70 +9.452s           15
##  4 4        18 Lance                   … Racing Poin…    70 +57.579s          12
##  5 5        23 Alexander               … Red Bull Ra…    70 +78.316s          10
##  6 6         5 Sebastian               … Ferrari         69 +1 lap             8
##  7 7        11 Sergio                  … Racing Poin…    69 +1 lap             6
##  8 8         3 Daniel                  … Renault         69 +1 lap             4
##  9 9        55 Carlos                  … McLaren Ren…    69 +1 lap             2
## 10 10       20 Kevin                   … Haas Ferrari    69 +1 lap             1
## 11 11       16 Charles                 … Ferrari         69 +1 lap             0
## 12 12       26 Daniil                  … AlphaTauri …    69 +1 lap             0
## 13 13        4 Lando                   … McLaren Ren…    69 +1 lap             0
## 14 14       31 Esteban                 … Renault         69 +1 lap             0
## 15 15        7 Kimi                    … Alfa Romeo …    69 +1 lap             0
## 16 16        8 Romain                  … Haas Ferrari    69 +1 lap             0
## 17 17       99 Antonio                 … Alfa Romeo …    69 +1 lap             0
## 18 18       63 George                  … Williams Me…    69 +1 lap             0
## 19 19        6 Nicholas                … Williams Me…    65 +5 laps            0
## 20 NC       10 Pierre                  … AlphaTauri …    15 DNF                0
# Generating a vector of all the years
years<-paste(20,20:15,sep = "")
# Loop through a list of data frames then add a column with the year raced for each data frame
results_2020_2015<-Map(cbind, results_2020_2015, year=years)

# Joining all data frames to create a single one
all_races<- bind_rows(results_2020_2015)
head(all_races)
##   Pos No                                                     Driver
## 1   1 44   Lewis                    Hamilton                    HAM
## 2   2 33   Max                    Verstappen                    VER
## 3   3 77  Valtteri                    Bottas                    BOT
## 4   4 18     Lance                    Stroll                    STR
## 5   5 23  Alexander                    Albon                    ALB
## 6   6  5 Sebastian                    Vettel                    VET
##                         Car Laps Time/Retired PTS year
## 1                  Mercedes   70  1:36:12.473  26 2020
## 2     Red Bull Racing Honda   70      +8.702s  18 2020
## 3                  Mercedes   70      +9.452s  15 2020
## 4 Racing Point BWT Mercedes   70     +57.579s  12 2020
## 5     Red Bull Racing Honda   70     +78.316s  10 2020
## 6                   Ferrari   69       +1 lap   8 2020
# Transforming to factor the position column and ordering them
all_races$Pos<-factor(all_races$Pos, levels = c(1:21,"NC"))

# Spliting the name and short name into individual columns
all_races<- all_races %>%
  separate(col = Driver,
         into = c("First_name","Last_name","Short_name"),
         sep = "\\s+")
Data visualization and analysis
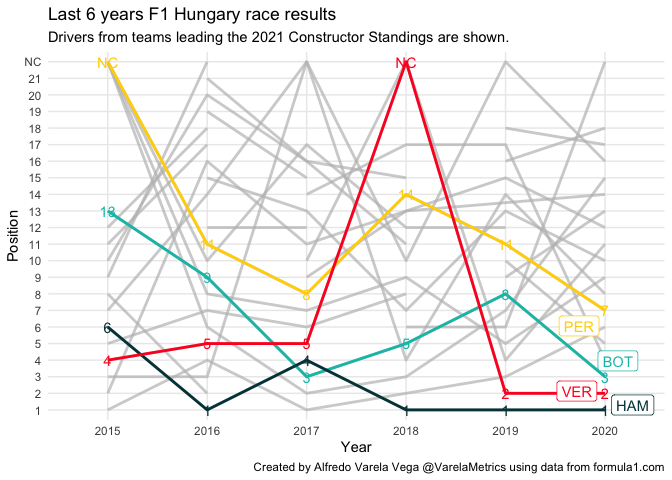
Interestingly, in 2015 when Max Verstappen was driving the STR Renault he managed to end 2 places ahead of Lewis Hamilton. Doing so in a year when Hamilton secured 10 victories and Mercedes finished first with 703 points in the Constructor Standings. That year, the STR Renault team would finish 7th with 67 points. Without a doubt an early view to Max’s bright future. In that same year, Sergio Perez would not finish the race due to a massive accident where he ended upside down in his Force India Mercedes.
2016 was the year that Max will debut with Red Bull and also the first of four wins for Lewis Hamilton in this 6 year window, finishing in P1 in 2016, 2018, 2019 and 2020. Max would only reach the second place in the last two Grand prix. It all seems to come into place for Lewis when he drives in the Hungaroring. Even when things do not go so well like in the 2017 where he ended almost securing the 3rd position but in a sportsmanship act he let his teammate Valtteri Bottas to pass him ending the race with much more than just another podium, admiration and respect from the audience.
ggplot(all_races, aes(x = year, y = Pos, group = Short_name, color = Short_name)) +
  geom_line(size = 1) +
  gghighlight::gghighlight(all_races$Short_name =="VER"|all_races$Short_name=="HAM"|all_races$Short_name=="PER"|all_races$Short_name=="BOT") +
  labs(title = "Last 6 years F1 Hungary race results", subtitle = "Drivers from teams leading the 2021 Constructor Standings are shown.", x = "Year", y = "Position",caption = "Created by Alfredo Varela Vega @VarelaMetrics using data from formula1.com") +
scale_color_manual(values = c("#03BFB5","#004146","#FFD300","#FF0026")) +
  theme_minimal() +
  geom_text(aes(label = Pos))
ggplot(all_races, aes(x = year, y = Pos, group = Short_name, color = Car)) +
  geom_line(size = 1) +
  gghighlight::gghighlight(all_races$Short_name =="VER"|all_races$Short_name=="HAM"|all_races$Short_name=="PER"|all_races$Short_name=="BOT", use_direct_label = FALSE) +
  labs(title = "Last 6 years F1 Hungary race results", subtitle = "Drivers from teams leading the 2021 Constructor Standings are shown with the color corresponding to the car they were driving in that year.", x = "Year", y = "Position", caption = "Created by Alfredo Varela Vega @VarelaMetrics using data from formula1.com") +
  scale_color_manual(values = c("#e36414", "#018076","#D90B7D","#12142D","#1B2B5A","#a74204","#52B6D6")) +
  geom_label(aes(label = Short_name),
               data = all_races %>% filter(year == max(year), Short_name == "PER"| Short_name == "HAM"| Short_name == "VER"| Short_name == "BOT"),
               nudge_x = 0.35,
               size = 2, show.legend = FALSE) +
  theme_minimal()
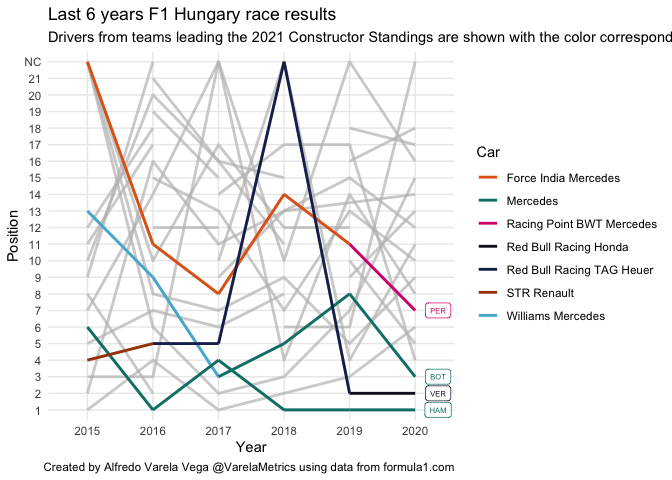
With his permanence in the team for next year still in doubt, a solid performance for Sergio Pérez is mandatory if he wants to claim back the 3rd place in the 2021 Driver’s Championship and give no reasons to hold back the contract to Red Bull. While we analyze his performance in this five year window we should take into consideration that this is his first year in Red Bull Racing Honda and probably the first year that he is driving for a real title contender team as opposed to the other drivers in the current analysis which in the worst of cases had been driving in top teams since 2017.
Fortunately, Sergio Pérez reached his best performance in the last Grand Prix finishing in 7th place, the year when he had the Racing Point BWT Mercedes, arguably his most competitive car prior to the RB16. Now with a better car it seems realistic to have a good starting position as in 2020 where he was 4th. Hopefully this time, he can hold on to it till the end of the race and fight for a podium position.
Enjoy the race
Thanks to Ferhat Deniz Fors @ferhat for making this photo available freely on Unsplash 🎁 https://unsplash.com/photos/y0nEulARNsk
Thanks to Moritz Graf @moritzgrf for making this photo available freely on Unsplash 🎁 https://unsplash.com/photos/pBJJdpd4Gs8
Last six Hungarian Grand Prix results (2015-2020) for the four drivers in the teams leading the Constructor Standings.

With the next Hungarian GP taking place, Red Bull Racing Honda is leading the 2021 Constructor Standings by only 4 points. In the haunt is Mercedes with their two drivers Lewis Hamilton and Valtteri Bottas, placing 2nd and 4th respectively in the Driver Standings.